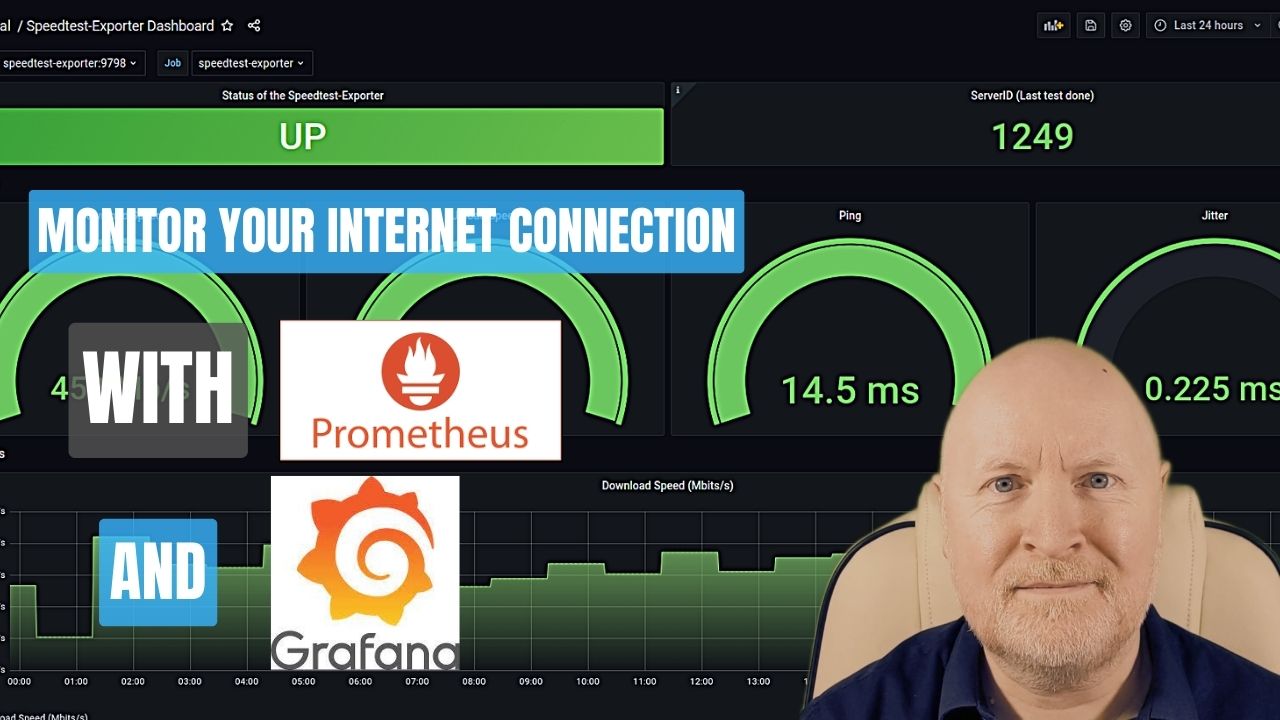
Monitor your Internet Connection With Prometheus And Grafana
In the video below, we show how to monitor your Internet connection with Prometheus and Grafana
A lot of the things we do these days relies on having an Internet connection
Now in the early days you just paid for access to the Internet and wanted an alert if it went down
But now you can purchase packages with different upload and download speeds, so it’s not just about monitoring reliability, but also consistency
In other words, are you getting the service you’re paying for or are there times during the day when there are slowdowns or dropouts?
Now an interesting open source combination of monitoring tools that’s available for free is Prometheus and Grafana
And in this video we go over how to configure Prometheus and Grafana to monitor your Internet connection, when you’re using Docker
Useful links:
https://prometheus.io/docs/instrumenting/exporters/
https://github.com/MiguelNdeCarvalho/speedtest-exporter
https://grafana.com/grafana/dashboards/13665-speedtest-exporter-dashboard/
Assumptions:
Now because this video is specifically about monitoring your Internet connection, I’m going to assume that you already have Prometheus and Grafana installed or you know how to set these up
If not then I do have another video which shows you how to install and configure these in Docker
Install Speedtest Exporter:
Prometheus relies on exporters for gathering metrics and ideally I’d prefer to use one they’ve listed on their website
Unfortunately the Speedtest Exporter they mention has been archived and hasn’t been updated in the past 2 years
Now I did find this one which is still being maintained so that’s what we’ll install https://github.com/MiguelNdeCarvalho/speedtest-exporter
Because I’m using Docker Compose then I need to edit the configuration file for that
nano docker-compose.ymlservices:
speedtest-exporter:
image: miguelndecarvalho/speedtest-exporter
container_name: speedtest-exporter
ports:
- '9798:9798'
restart: unless-stoppedNow save and exit
This is based on the example configuration provided on the Github webpage which was helpful
So we’re referencing the image to download and run as well as providing a name for the container to make it easier to identify
We’re using the default port and want this to be automatically restarted if the server reboots for instance, but not if we manually stop the container for maintenance
Now we can start the container
docker compose up -dConfigure Prometheus:
The next thing to do is to configure Prometheus to scrape metrics from the Speedtest Exporter
So we’ll edit the configuration file and create a job for that
nano prometheus/prometheus.ymlscrape_configs:
- job_name: 'speedtest-exporter'
scrape_interval: 1h
scrape_timeout: 1m
static_configs:
- targets: ['192.168.102.30:9798']Now save and exit
Again, this is based on an example from the developer’s Github page
Out of courtesy we don’t want to be running tests like this too often although not only does it place a load on the server but also on your own Internet connection
So in this example a check is made every 1 hour. As a result, you have to wait 1 hour before you’ll get the first results
Because the exporter is in a different container and I don’t want to overcomplicate things, the target is the IP address of the computer running Docker and the port the exporter uses
TIP: If you restrict outbound Internet access, which you should, the computer will need access to servers on the Internet for TCP port 8080
As we’ve changed the configuration file we either need to reload this container or as I’ve configured Prometheus to allow me to reload its configuration I’ll run this command
curl -X POST localhost:9090/-/reloadInstall Grafana Dashboard:
While you can create your own dashboards, others provide their dashboards to the public which you can find on the Grafana website
https://grafana.com/grafana/dashboards/
One I’ve found to be useful and the one suggested by the developer is this one https://grafana.com/grafana/dashboards/13665-speedtest-exporter-dashboard/
You can pick another one if you prefer but in this example click Copy ID to clipboard
Login to Grafana
In the top left corner click the menu button and select Dashboards
Now click on the New drop-down menu on the right and select Import
Paste the ID you copied into the Import via grafana.com field then click Load
Change the name of the dashboard if you’d prefer but lower down select the Prometheus data source we created then click Import
Over time you should get a useful visual trend of how your Internet connection is performing
If you notice regular slowdowns or dropouts at certain times of the day then it’s worth investigating
Typically your Internet bandwidth connection will be shared among neighbours so a slowdown may be seen during peak times
But there might be something else causing this
For instance maybe a network device or device is under load at certain times
In any case, you now have a means to monitor your Internet connection
Sharing is caring!