Monitor TLS Certificates With Prometheus And Grafana
In the video below, we show how to monitor TLS Certificates with Prometheus and Grafana
Unless you’re using an automated method of obtaining TLS certificates for your IT devices, then you need to manage and monitor them
And the reason for that is because a certificate will have an expiry date, or at least it should if you’re concerned about security
So you need to be proactive and replace certificates before they expire, otherwise a browser will either complain when a certificate expires and so will the users or worse still a browser will refuse to connect to a device
Now an interesting open source combination of monitoring tools that’s available for free is Prometheus and Grafana
And in this video we go over how to configure Prometheus and Grafana to monitor TLS certificates, when you’re using Docker
Useful links:
https://github.com/prometheus/blackbox_exporter
https://grafana.com/grafana/dashboards/13659-blackbox-exporter-http-prober/
Assumptions:
Now because this video is specifically about monitoring TLS certificates, I’m going to assume that you already have Prometheus and Grafana installed or you know how to set these up
If not then I do have another video which shows you how to install and configure these in Docker
Install Blackbox Exporter:
The first thing to do is to install the blackbox exporter which can be used to monitor all sorts of connnections
And we’re going to install this as a container in Docker which is also running Prometheus and Grafana
One way to configure Docker is to use Docker Compose so we’ll edit the YAML file
nano docker-compose.ymlservices:
blackbox-exporter:
image: quay.io/prometheus/blackbox-exporter:latest
container_name: blackbox_exporter
ports:
- '9115:9115'
restart: unless-stopped
volumes:
- ./blackbox:/config
command:
- '--config.file=/config/blackbox.yml'Now save and exit
This has been adapted from an example on the github webpage for use with Docker Compose
We’re sticking to the default port and although I want the container to be running 24x7, I’ve opted for unless-stopped rather than always so the container won’t be automatically restarted if I stop it manually for say maintenance
I also like to keep configurations in separate folders so I’ve mapped the config folder to one we’ll create later called blackbox
Configure Blackbox Exporter:
The exporter requires a configuration file, but first we’ll create a new folder for it
mkdir blackboxThe github webpage provides a default configuration file as an example, but I’ve added in a module called https_2xx to check TLS certificate validation
modules:
  http_2xx:
    prober: http
    http:
      preferred_ip_protocol: "ip4"
  https_2xx:
    http:
      fail_if_not_ssl: true
      method: GET
      follow_redirects: false
      preferred_ip_protocol: ipv4
      tls_config:
        ca_file: "/config/root-ca.crt"
    prober: http
    timeout: 5s
  http_post_2xx:
    prober: http
    http:
      method: POST
  tcp_connect:
    prober: tcp
  pop3s_banner:
    prober: tcp
    tcp:
      query_response:
      - expect: "^+OK"
      tls: true
      tls_config:
        insecure_skip_verify: false
  grpc:
    prober: grpc
    grpc:
      tls: true
      preferred_ip_protocol: "ip4"
  grpc_plain:
    prober: grpc
    grpc:
      tls: false
      service: "service1"
  ssh_banner:
    prober: tcp
    tcp:
      query_response:
      - expect: "^SSH-2.0-"
      - send: "SSH-2.0-blackbox-ssh-check"
  irc_banner:
    prober: tcp
    tcp:
      query_response:
      - send: "NICK prober"
      - send: "USER prober prober prober :prober"
      - expect: "PING :([^ ]+)"
        send: "PONG ${1}"
      - expect: "^:[^ ]+ 001"
  icmp:
    prober: icmp
  icmp_ttl5:
    prober: icmp
    timeout: 5s
    icmp:
      ttl: 5
Now save and exit
The setting for fail_if_not_ssl has been set to true to make sure we have a valid TLS connection
In other words, even if the web server is working, if the certifcate isn’t trusted or has expired, the connection will fail
Older examples use no_follow_redirects but this parameter is now follow_redirects and it’s to prevent the server redirecting the client. I’ve set this to false to avoid being redirected from HTTPS to HTTP for instance
Unless you want to use IPv6, the preferred protocol should be IPv4
As I’m using an internal CA to create my certifcates, I’ve included details for the root CA certificate file as otherwise certificates won’t be trusted
But although the folder for this is defined as config, this is from the container’s perspective and so we’ll actually copy our root certificate file to the blackbox folder which is what the config folder is mapped to
NOTE: This isn’t necessary if your certificates are provided by a trusted Public CA, unless they provide you with an intermediary certificate for instance
Now we can start the container
docker compose up -dConfigure Prometheus:
The next thing to do is to configure Prometheus to scrape metrics from the blackbox exporter
So we’ll edit the configuration file
nano prometheus/prometheus.ymlscrape_configs:
- job_name: 'blackbox'
metrics_path: /probe
params:
module: [https_2xx]
static_configs:
- targets:
- https://apache1.homelab.lan
- https://apache2.homelab.lan
relabel_configs:
- source_labels: [__address__]
target_label: __param_target
- source_labels: [__param_target]
target_label: instance
- target_label: __address__
replacement: 192.168.102.30:9115Now save and exit
Again, this is based on an example from the developer’s github webpage
The key things to point out are that we need to specify the correct module to use, in this case we created one called https_2xx
We need to define the targets to monitor and these URLs need to be correct to avoid redirects for instance and typically they need to be an FQDN as that’s usually what a TLS certificate will be based on
Because the exporter isn’t installed on the remote devices, we also have to do some re-labelling. Just make sure to provide the real IP address for what it’s running on, in my case it’s the same computer that Prometheus and Grafana are running on
As we’ve changed the configuration file we either need to reload the container or as I’ve configured Prometheus to allow me to reload its configuration I’ll run this command
curl -X POST localhost:9090/-/reloadYou can check the connectivity status to the exporter in Prometheus by pointing a web browser to port 9090 for Prometheus itself and navigating to Status | Targets
You should see the targets you defined with a status of up
However, we want to check certifcate validation and to do that point a web browser to port 9115 of the docker server instead
If the result is a failure, you should check the debug logs to find out why
Assuming the certificates are valid and trusted you should see a Success status
Install Grafana Dashboard:
Although we can check the status of targets by directly querying the exporter, a Grafana dashboard provides a better way to visualise everything
While you can create your own dashboard, there are others who provide dashboards to the public for free, which you can find on the Grafana website
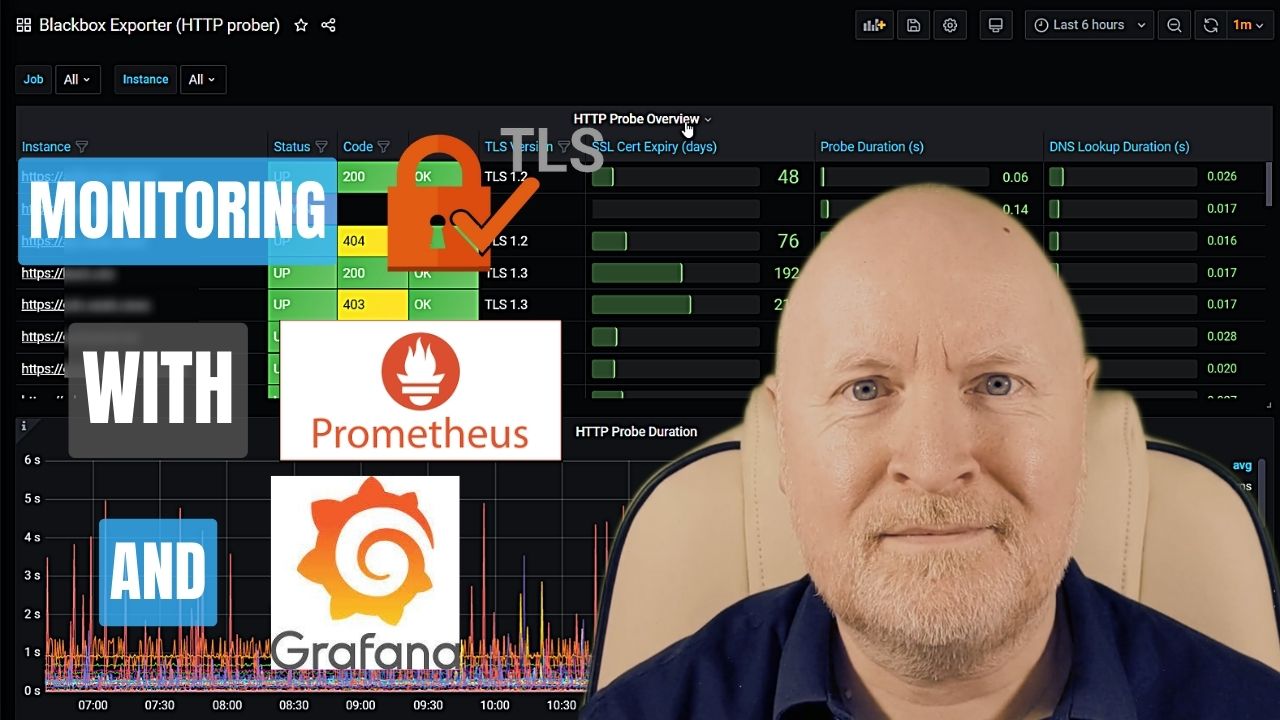
One I’ve found to be useful is this one
https://grafana.com/grafana/dashboards/13659-blackbox-exporter-http-prober/
It provides a list of the targets, along with useful information such as the connectivity status, TLS version, when the certificate will expire, etc
Whichever dashboard you opt for, connect to Grafana, in the top left corner, click the menu button and select Dashboards
Now click on the New drop-down menu on the right and select Import
Paste the ID you copied into the Import via grafana.com field then click Load
Change the name of the dashboard if you’d prefer but lower down select the Prometheus data source then click Import
Now it will take time to collect more data but you now have a way to monitor your TLS certifcates
Sharing is caring!