How To Send Alerts in Prometheus - Alertmanager
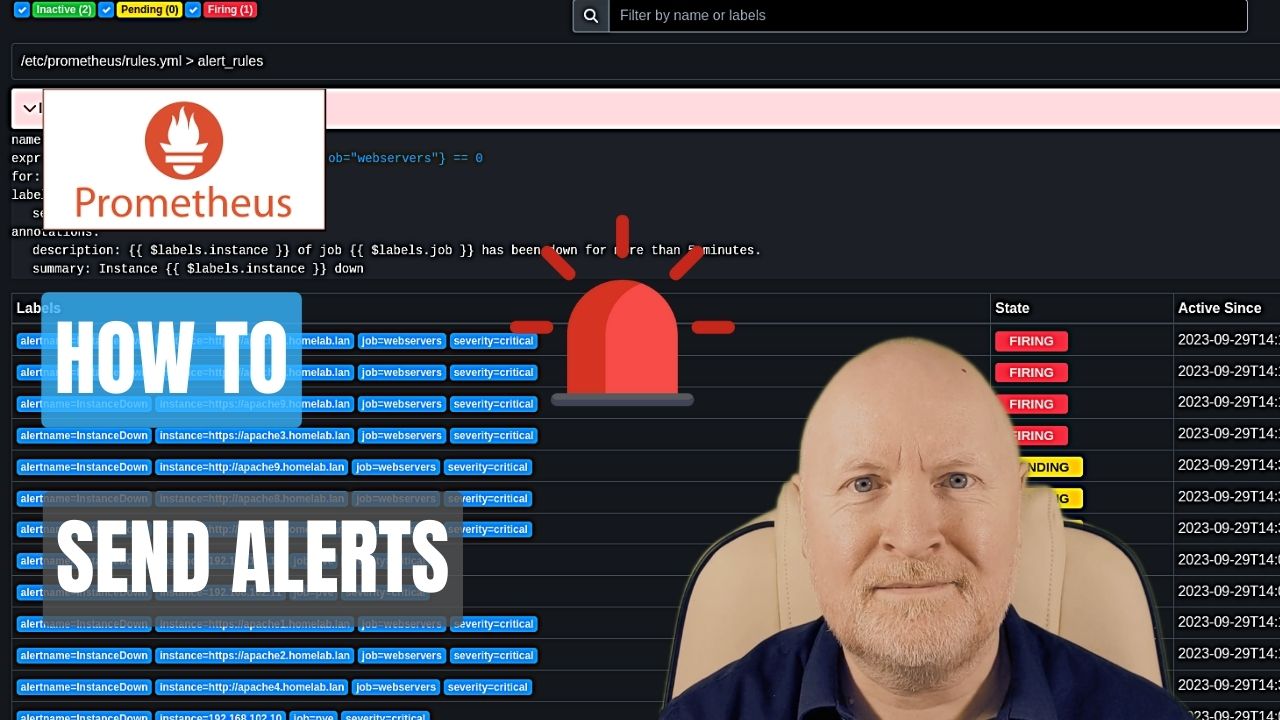
In the video below, we show how to configure Prometheus to send alerts
Monitoring computers is very important and that should include alerts being sent out when something has gone wrong, but ideally even before a problem occurs
Now Prometheus does support alerting and you can even customise your own alerts
But it relies on a separate entity known as Alertmanager to actually send alerts to an email server for instance
And in this video we go over how to install and setup Alertmanager, how to configure Prometheus to use it, and how to create alerting rules in Prometheus
Useful links:
https://github.com/prometheus/alertmanager
https://prometheus.io/docs/alerting/latest/configuration/
https://prometheus.io/docs/prometheus/latest/querying/basics/#instant-vector-selectors
https://samber.github.io/awesome-prometheus-alerts/
Assumptions:
Now because this video is about setting up alerts for Prometheus, I’m going to assume that you already have Prometheus installed or you know how to set this up
If not then I do have another video which shows you how to install and configure Prometheus in Docker
In addition, we’ll be sending email alerts in this video, so I’m going to assume you have an email server you can send these to
Although Alertmanager does support other messaging options, however
Install Alertmanager:
While you can create alerts within Promethues, it relies on a separate entity called Alertmanager to send alerts to an email server for instance
To install this we’ll use Docker Compose and that means editing the config file
nano docker-compose.ymlvolumes:
alertmanager-data: {}
services:
alertmanager:
image: quay.io/prometheus/alertmanager:latest
container_name: alertmanager
ports:
- "9093:9093"
restart: unless-stopped
volumes:
- ./alertmanager/alertmanager.yml:/etc/alertmanager/alertmanager.yml
- alertmanager-data:/dataNow save and exit
We want the latest version of Alertmanager and we’ll give it a name to make it easier to identify
We’ll also stick to the default port of 9093 and we want this to be automatically re-started, unless we manually stop it for maintenance for instance
Alertmanager needs a configuration file so we’ll map the one the container expects to an external file so that we can edit it and it survives a reboot
Although we won’t be setting up silence rules in this video, for data like that to persist we need to create a volume and map the data folder to that
Configure Alertmanager:
With Alertmanager installed, it now needs to be configured but first we need to create the folder we referenced
mkdir alertmanagerAnd then we can create the configuration file
nano alertmanager/alertmanager.ymlroute:
receiver: 'email'
repeat_interval: 4h
group_by: [alertname]
receivers:
- name: 'email'
email_configs:
- smarthost: 192.168.102.30:8025
from: 'prometheus@homelab.lan'
to: 'slack@mailrise.xyz'
require_tls: falseNow save and exit
Although there is a global section for Alertmanager, we won’t be needing to set anything in that for this example
But I would suggest checking the documentation when dealing with complex setups, multiple receivers, etc.
The route section is the top level for handling alerts and there can be multiple levels to this to suit your own purposes but for this example we’ll stick to a simple solution of sending email alerts when an alert is triggered
The receiver option is just a label but this needs to match the name of a receiver that will be defined lower down. In this example we’ll create one called email as the goal is to send an email alert
The repeat interval decides how long to wait before sending another alert after successfully sending one. The suggestion is to send an alert after 3 hours or more
You’ll want to leave a reasonable amount of time for someone to deal with an alert, but not too long in case they missed it. So this is one of those settings you might want to experiment with
The group_by option is a means to aggregate alerts and in this example we’re grouping them based on the alerting rule
So if we are monitoring the up state of servers in an alerting rule, when two servers go down at the same time we’ll get one message containing details of both alerts rather than two separate messages
But you can add additional options, by separating them with a comma
An example on the website for instance shows a grouping like this
[alertname, datacenter, app] The receivers section is where further details about receivers are defined and these contain the details of how and where to send alerts
There are a lot of options available for sending alerts but in this example we’ll use email
The name of the receiver needs to match the label defined earlier and in this example, the details provide all the information needed to send an email alert
In this example, there is no authentication required and because TLS hasn’t been set up for MailRise yet I’ve had to disable its use
But if you’re using a public SMTP server or one that uses authentication, then the receiver configuration would more likely look something like this
receivers:
  - name: 'email'
    email_configs:
      - smarthost: smtp.gmail.com:587
        from: 'myserver@gmail.com'
        to: 'myalerts@gmail.com'
        auth_username: 'myserver@gmail.com'
        auth_password: 'myemailpassword'
        auth_identiy: 'myserver@gmail.com'
As an aside, although I could configure Alertmanager to send alerts directly to Slack for instance, in a previous video I covered how to setup and use MailRise to send alerts to Slack
By having an internal email gateway like MailRise, every device can be configured in the same way because they support email alerts
This makes administration so much easier because it will be far simpler to change what type of alerts are sent or where they’re sent to because it only requires a change on the MailRise server
Anyway, now that we have a configuration defined, we can tell Docker Compose to run this
docker compose up -dTIP: If you make any further changes to this config file, Alertmanager can reload this by using a command like the following
curl -X POST localhost:9093/-/reloadConfigure Promethus:
Because Alertmanager is a separate entity, we need to update Prometheus and tell it about it
In addition, alerts for Prometheus are stored in a rule file so we need to tell it about that as well
nano prometheus/prometheus.ymlglobal:
evaluation_interval: 15s
rule_files:
- 'rules.yml'
alerting:
alertmanagers:
- static_configs:
- targets:
- 192.168.102.30:9093Now save and exit
First we define the evaulation interval. The default is 15 seconds but I’d prefer to still put this here in case I want to change it at a later date
What this settings does is to determine how often to evaluate rules
Next we have to point Prometheus to a rules file, which for this example is called rules.yml
And then we point Prometheus to the Alertmanager container we created
Now because we’re using containers in this video, the IP address of the computer itself is used, along with the port that Alertmanager is listening on
Instance Down Alert:
Alerts need to be defined as rules for Prometheus and a common alert is for when a device is no longer responding or has at least been marked as failed by monitoring
This will be a YAML file and so we’ll create one to match the name used in the setup of Prometheus
nano prometheus/rules.ymlgroups:
- name: alert_rules
rules:
- alert: InstanceDown
expr: up == 0
for: 5m
labels:
severity: critical
annotations:
summary: "Instance {{ $labels.instance }} down"
description: "{{ $labels.instance }} of job {{ $labels.job }} has been down for more than 5 minutes."Now save and exit
You can group rules under whatever name you like, but as we’re creating alert rules we’ll name the group alert_rules
Additional alerting rules should then be added under this rules: section
Each alert needs a name, and in this example we’re using a simple up query to alert us if an instance is not showing as up after 5 minutes of querying i.e. it’s likely to be down; Feel free to set a different interval as the for setting
If something isn’t responding, it would usually be deemed a critical issue, so we’ve set the severity as critical. You can choose other labels but stick to consistent ones because these can be used for filtering alerts
The annotations setting can contain details made up of wording as well as metrics in the form of labels and is used to provide information in the alert
Usually an email has a summary and a subject so that’s basically what’s been done here, but do check out the documentation for more options
Update Prometheus Container and Test:
Because we’ve introduced another configuration file for Prometheus to refer to, we’ll need to update the Docker Compose file to map this to an external file we can edit and one which will survive a reboot
nano docker-compose.ymlservices:
prometheus:
volumes:
- ./prometheus/rules.yml:/etc/prometheus/rules.ymlNow save and exit
Restarting the container didn’t work for me, I ran into issues where the rules file didn’t appear to be loading
By that I mean, when I checked the browser under Alerts or Status | Rules there was nothing to be seen, and there were no errors in the logs
In which case we’ll stop the container
docker container stop prometheusThen start it back up again in the background
docker compose up -dAssuming no errors are reported then leave Prometheus for a while and if you navigate to Status | Rules you should see the rule defined
And if you navigate to Alerts, assuming there are no problems, the alert should show 0 active i.e. there are no instances down
If you do experience problems, check the logs file, for example
docker container logs prometheusTIP: Double check spacing in these YAML files as even just a slight mistake can cause things to not work
NOTE: As this is a container, I don’t know of a means to take advantage of promtool to check configuration files without running a separate instance of prometheus which isn’t being run in a container
WARNING: Don’t assume because an alert hasn’t been triggered that a device is actually up and working. For example, I ran a test using the up expression and the blackbox exporter was reporting two web servers as up when in fact one of them was down. Presumably up for that exporter is the state of the exporter itself. On the other hand, the up expression did work for the pve exporter as it was reporting two nodes as being down so it was reporting on the status of the end devices
One way to check is to navigate to Status | Targets and see if the State is reported as down when a device is actually down
TIP: In the case of the blackbox exporter check the probe_success metric instead of up. For example, you could use an expression like this
up{job="pve"} == 0 or probe_success{job="webservers"} == 0Expressions:
Now you may be wondering where did this up expression come from when creating the rule and what others are there that you can use?
Well actually when you first connect to Prometheus or click on the Prometheus name or icon you’ll be on the homepage where you can look for and test out expressions which are based on the metrics that are being collected
You can start typing in the search field or click the metrics explorer button, which in turn lists but also lets you search metrics
Once you find a metric you’re interested in, select that and click the Execute button or hit return
This will provide a value for a metric as of the last scrape
Sometimes it’s the values you see that will help you decide what the expression should be
For example, up returns values of 1 when something is active and 0 for when its inactive. So that’s why the expression for a server that is down is up == 0
On the other hand maybe you want to trigger an alert if a metric goes above or below a certain in which case you’ll be using the > and < operators
And sometimes you’ll combine metrics together to return percentage values
We’ll run through some more examples, but a really good place to look for other alerts is here: https://samber.github.io/awesome-prometheus-alerts/
Low Disk Space Alert and Rounding:
If a storage device runs out of disk space that will likely result in the computer stopping working for instance
Now although Prometheus has a sophisticated way of predicting when a resource will run out, I want to know when a disk has reached around 80% of its capacity
Because as a general guide, when a resource exceeds 80% of utilisation it slows down, so it’s better to take action as soon as a threshold has been exceeded as otherwise a disk in this case will be slower to write to and read from
It also gives me time to try and free up space or order a replacement and plan an upgrade
For Linux devices using the Node Exporter for capturing metrics, we could set up an alerting rule like this
nano prometheus/rules.yml rules:
- alert: HostOutOfDiskSpace
expr: round(node_filesystem_avail_bytes{mountpoint="/"}/node_filesystem_size_bytes{mountpoint="/"}*100,0.01) < 20
for: 5m
labels:
severity: warning
annotations:
summary: "Host running out of disk space (instance {{ $labels.instance }})"
description: "Disk is almost full {{ $value }}%,"Now save and exit
The expression used is a ratio of the available bytes that are left versus the overall capacity of the storage. By turning this into a percentage we can then set the alert to trigger when this drops below 20% in other words, when we’ve exceeded 80% of capacity
In addition, to make it simpler to read in the alert, the calculated value is rounded down so we only have the last two decimal places
The mountpoint incidentally is the root i.e. / and this is to filter out other partitions that would otherwise be returned and lead to false positives
You can test the entire expression or parts of it in the GUI and that’s a good way to test and check if an expression is going to work in the way you expect it to or even to experiment
For Windows computers incidentally, different metrics will need to be used
For the changes to take effect, either restart Prometheus or if configured to support this send it a reload command
curl -X POST localhost:9090/-/reloadNOTE: I’ve noticed no matter what order I place the lines for the annotations, the description still ends up being mentioned before the summary which doesn’t really make sense for an alert
Certificate Expiry Alert:
If you’re manually maintaining TLS certificates then you’ll want an alert before they expire
Because once a certificate does expire it’s too late because the web browser will then start complaining and may even lock the user out
And things will remain like that until a new certificate is created and the existing one replaced, which takes time
So we want to be warned ahead of time by sending an alert when a certificate has say less than 7 days left so that we can replace the certificate before it expires and avoid any disruption
As an example,
nano prometheus/rules.yml rules:
- alert: TLSExpiry
expr: probe_ssl_earliest_cert_expiry - time() < 86400 * 7
for: 5m
labels:
severity: warning
annotations:
description: "TLS certificate will expire in {{ $value | humanizeDuration }}"Now save and exit
At a high level, the expression compares the certificate’s expiry date to today’s date and time and then checks if there is less than 7 days left
The value returned is in milliseconds, hence why we had to multiply 7 by 86400 for our comparison
And in the annotation we take advantage of the humanizeDuration function to make the result easier to understand in the alert itself
I’ve also removed the summary part in this example, because as mentioned before, the ordering of the summary and description makes no sense, so I may as well just have one line for what is eventually ending up as Slack message for me
For the changes to take effect, either restart the container or if configured to support this send a reload command
curl -X POST localhost:9090/-/reload
Sharing is caring!